scRNA-seq Analysis
Introduction
The Single Cell RNA-seq tool is a framework to analyze single cell RNA sequencing data with cluster plots and gene expression overlays.
Launch Single Cell RNA-seq Tool
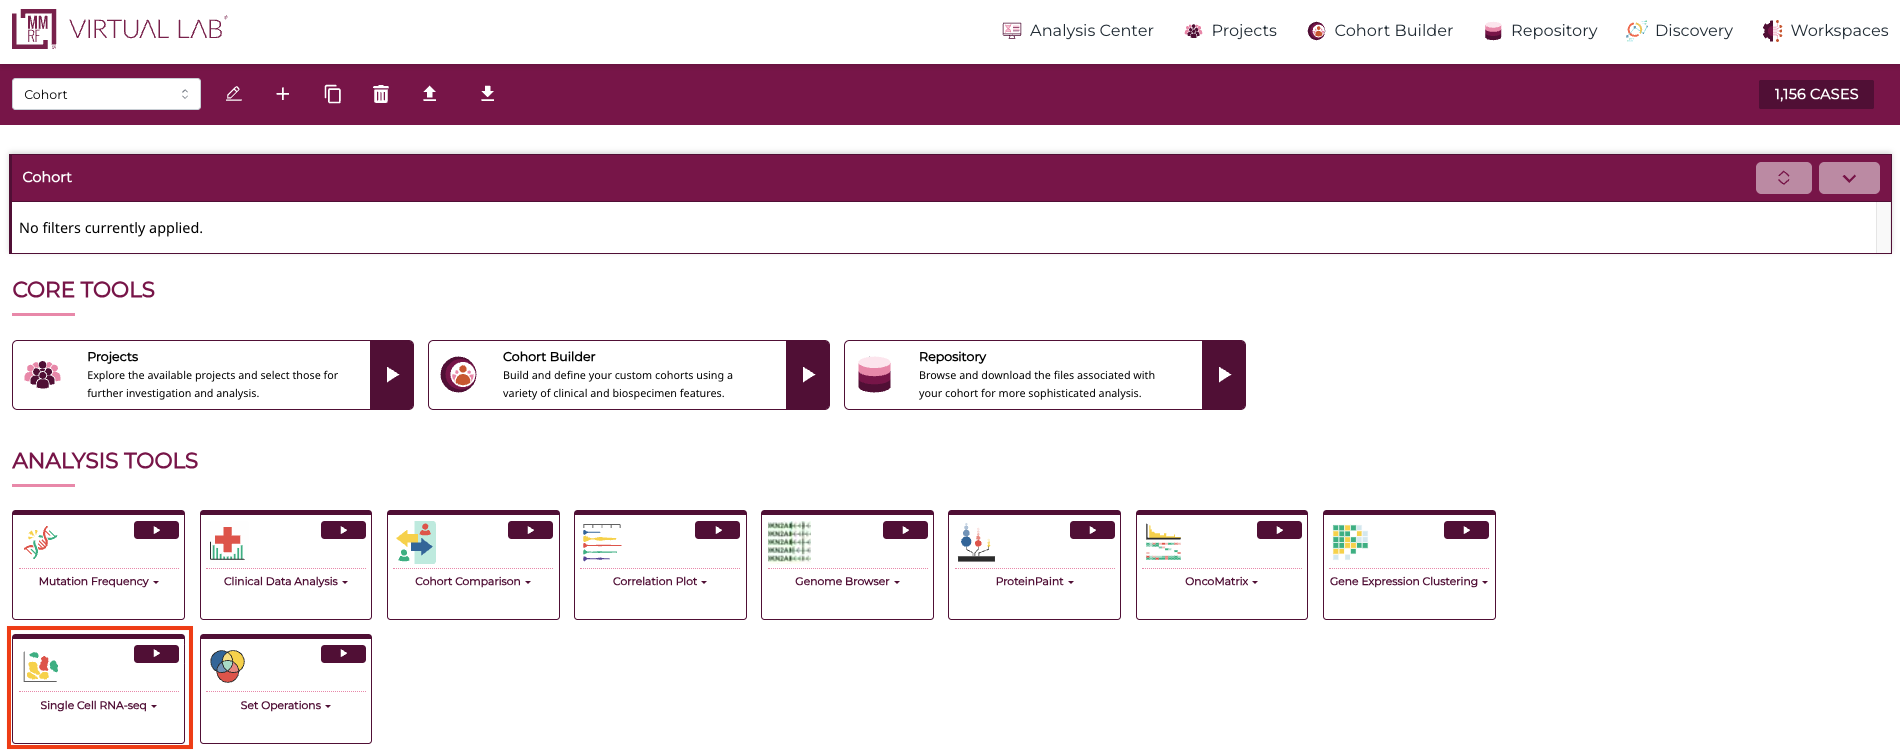
While in the Analysis Center, select the "Single Cell RNA-seq" card.
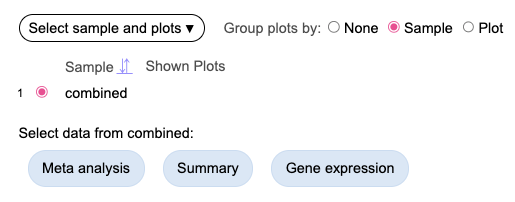
To launch the single-cell RNAseq tool, select “combined” from the data table. A set of blue-colored buttons will be shown.
Meta Analysis (UMAP)
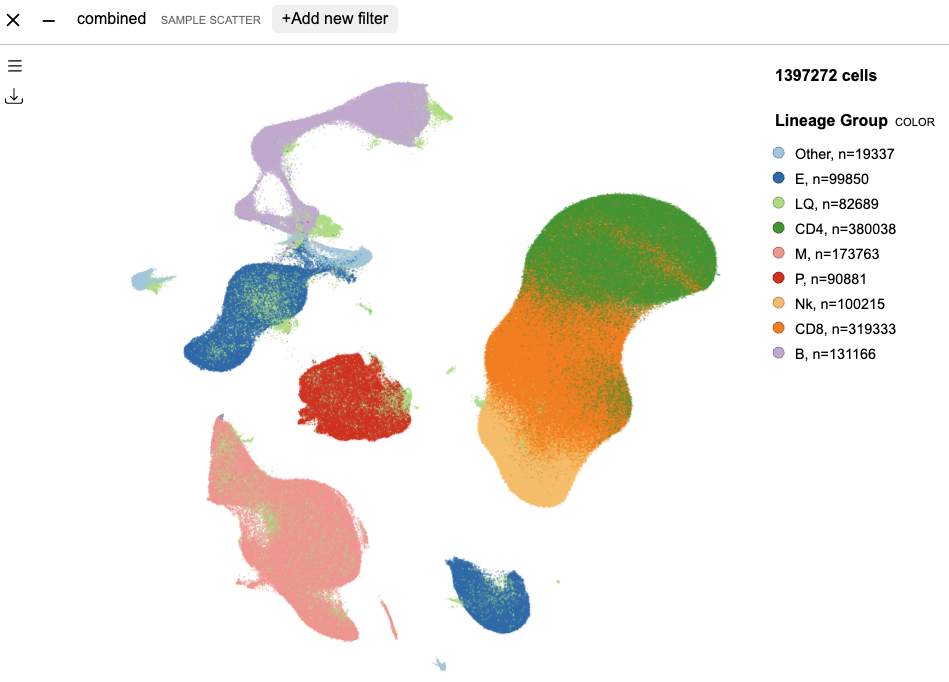
Clicking the "Meta analysis" button will display a UMAP plot for nearly 1.4 million cells. Each dot is one cell, the color of each cell represents the cells lineage group, which is also shown in the legend on the right.
Isolate Lineage Groups
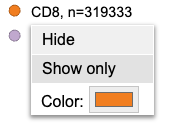
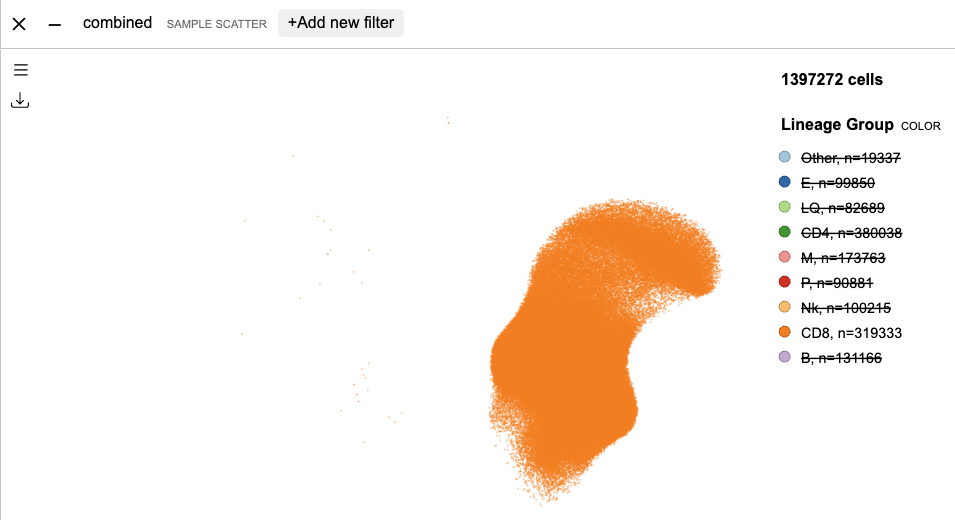
Using the legend, users can selectively narrow down to cells from specific lineage groups. As example, click the “CD8” entry and select “Show only” option, the UMAP updates to only show CD8 cells. To go back to showing all cells, click on any legend entry and select “Show all”.
Single-cell Cell Type Selection
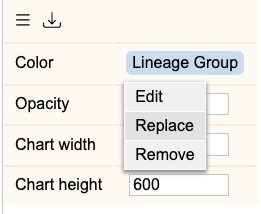
The UMAP overlays with “Lineage Group” by default. Users can switch to a different cell type variable. Click the menu button on top left of the UMAP to show customization options. Click on the “Lineage Group” tag and select “Replace” option.
This displays available single-cell cell type variables as below.
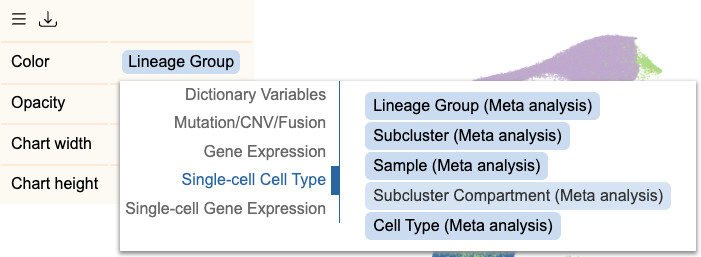
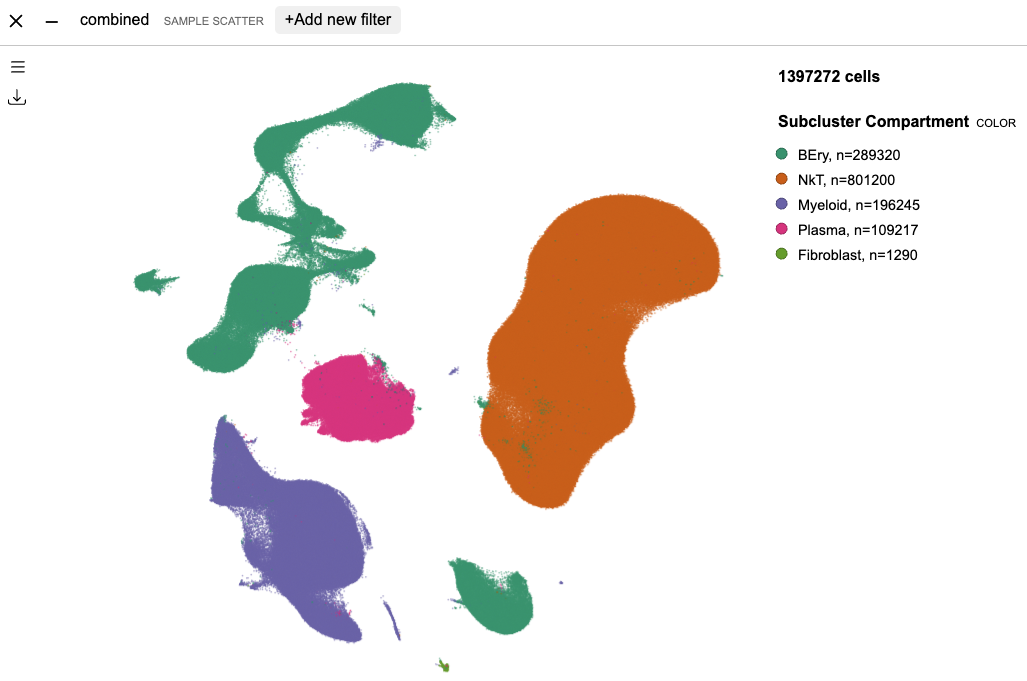
Here selecting “Subcluster Compartment” will update the UMAP as below.
Lineage Group Selection
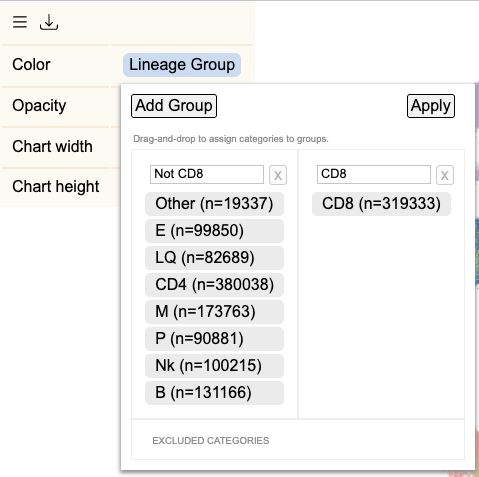
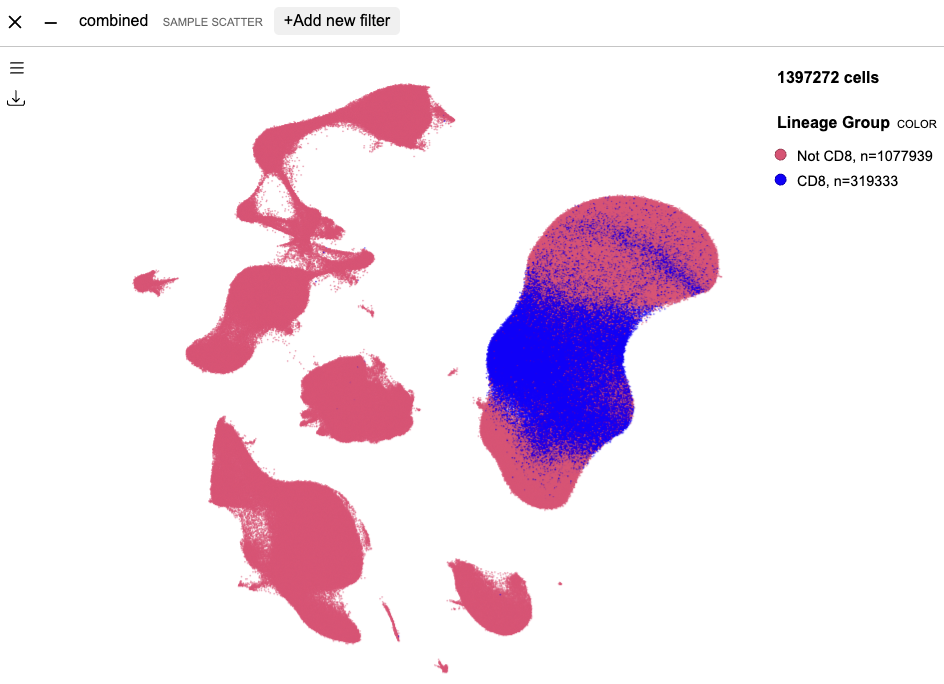
In the UMAP overlay, multiple cell types can be assigned to a group. For example, in the customization menu, click on “Lineage Group” tag, and select “Edit” function. This displays the following menu where CD8 cell type can be separated out of the rest of cell types via drag and drop. The group names are customizable, as shown with the new group names; “Not CD8” and “CD8”.
By applying this change, the UMAP changes as shown below.
Single-cell Gene Expression
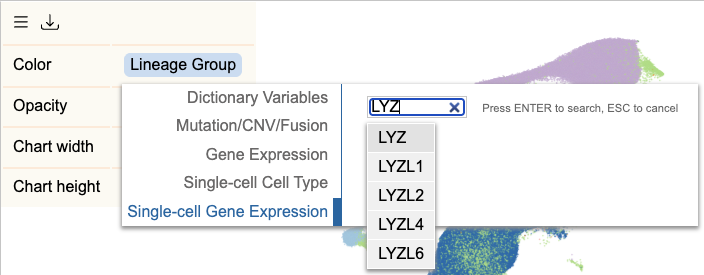
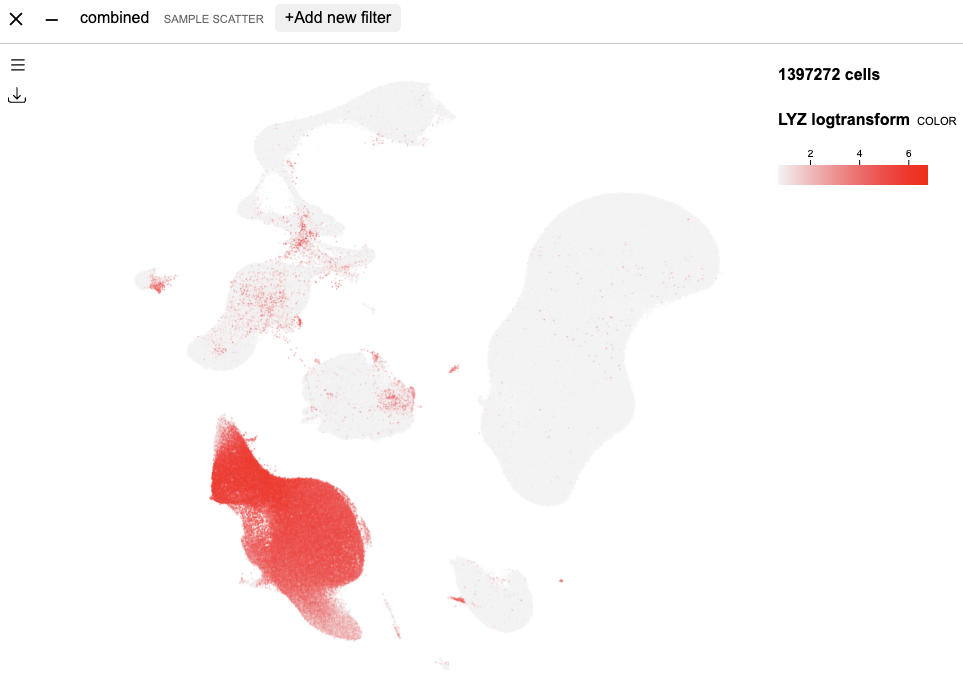
Finally, the user can select a gene to overlay its per-cell expression level on the UMAP. Click on the cell type tag and select “Replace”, then select “Single-cell Gene Expression”. At the search box, type to find any gene in the human genome.
Below, cell-level LYZ gene expression value is overlaid on UMAP.
Gene Expression
This next section covers how to summarize cell-level gene expression.
From the data type selector above, select “Gene expression” button. At the new sandbox, type in a gene name to find a gene.
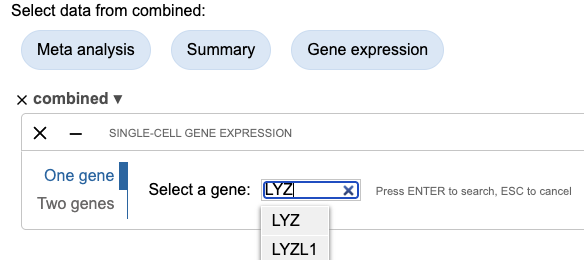
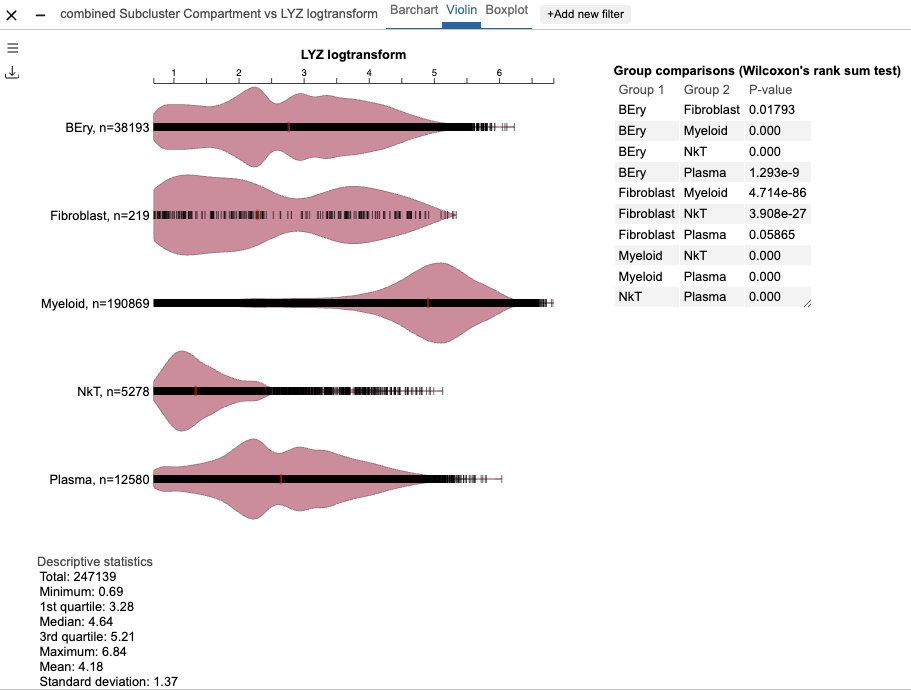
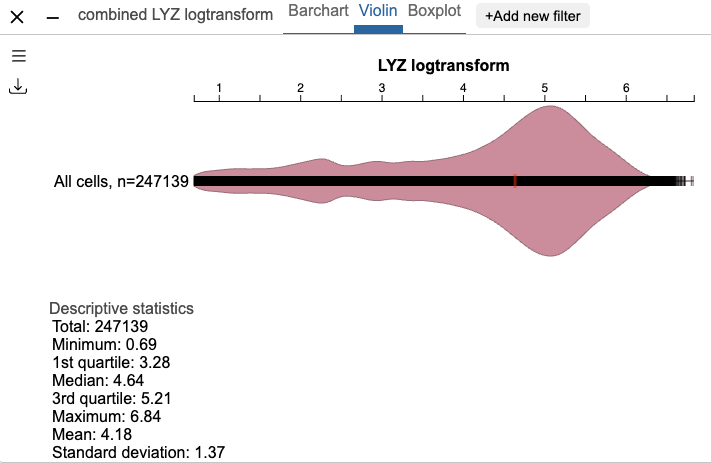
On searching gene LYZ, a violin plot will be shown for distribution of LYZ expression level in all expressed cells.
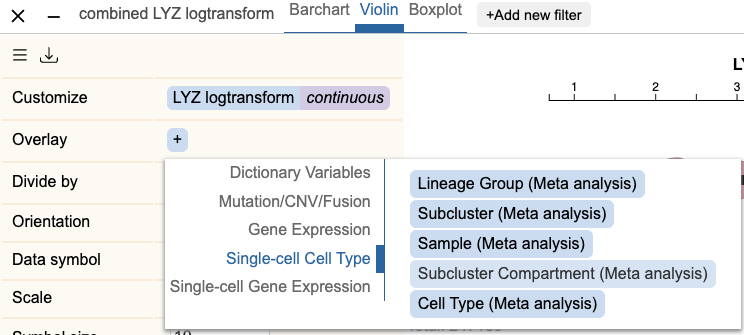
To compare LYZ expression between cell types, click the menu button at top left of violin plot box. At “Overlay”, click the tag to find the variable selection panel. Here, choose “Single-cell Cell Type”, and select “Subcluster Compartment”.
The violin plot updates to show multiple violins for each compartment, and shows LYZ is highly expressed in myeloid compartment.