Gene Expression Clustering Tool
Introduction
The Gene Expression Clustering tool is a web-based tool for performing sample clustering by selecting a desired set of genes and visualizing a heatmap of a z-score transformed matrix.
Quick Reference Guide
At the Analysis Center, click the 'Gene Expression Clustering' card to launch the heatmap.
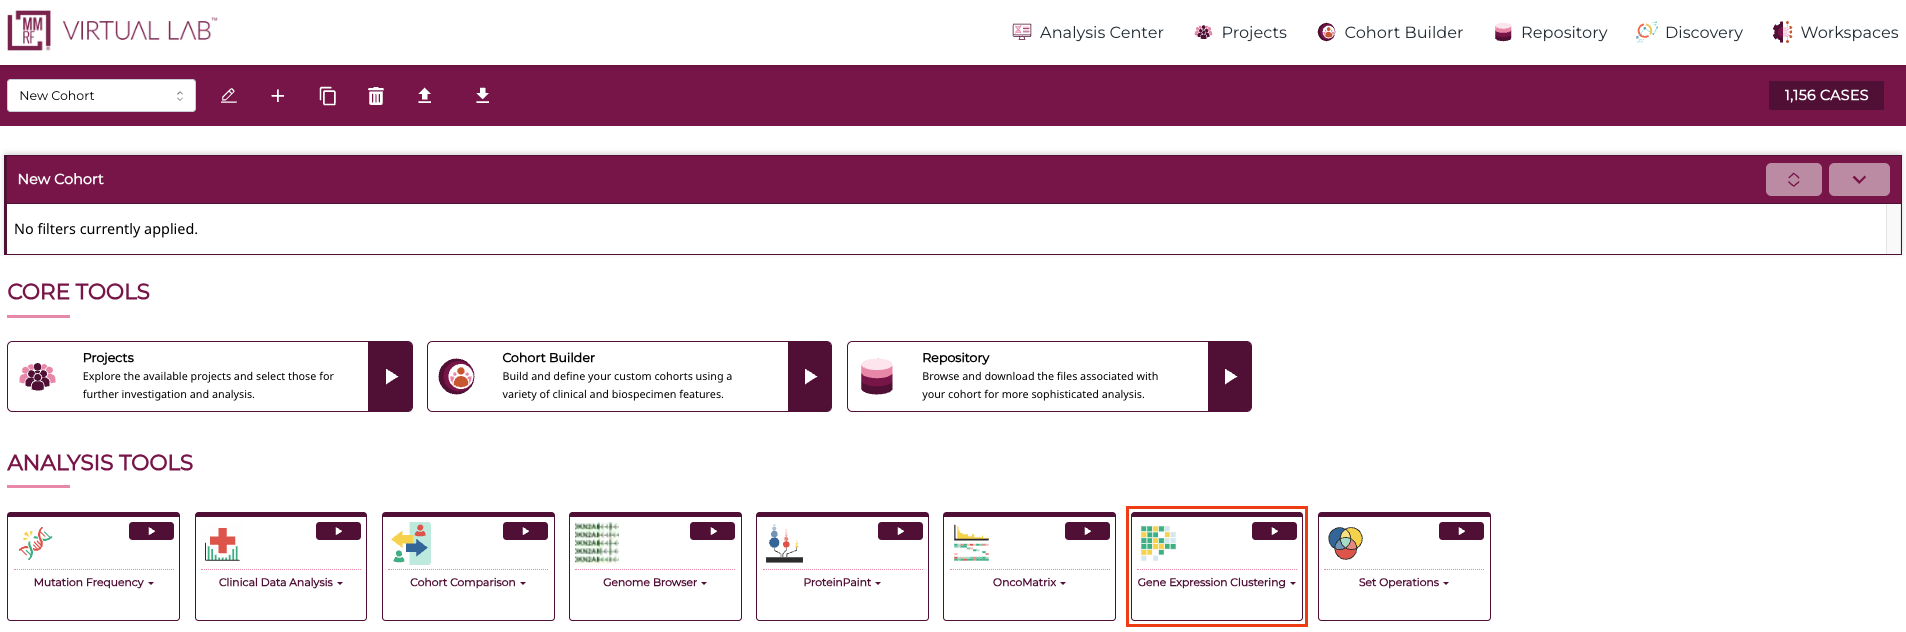
Once inside the tool, users can define a gene set using the default top 1,000 most variably expressed genes (customizable), select a prebuilt gene set, or upload/provide a custom gene set.
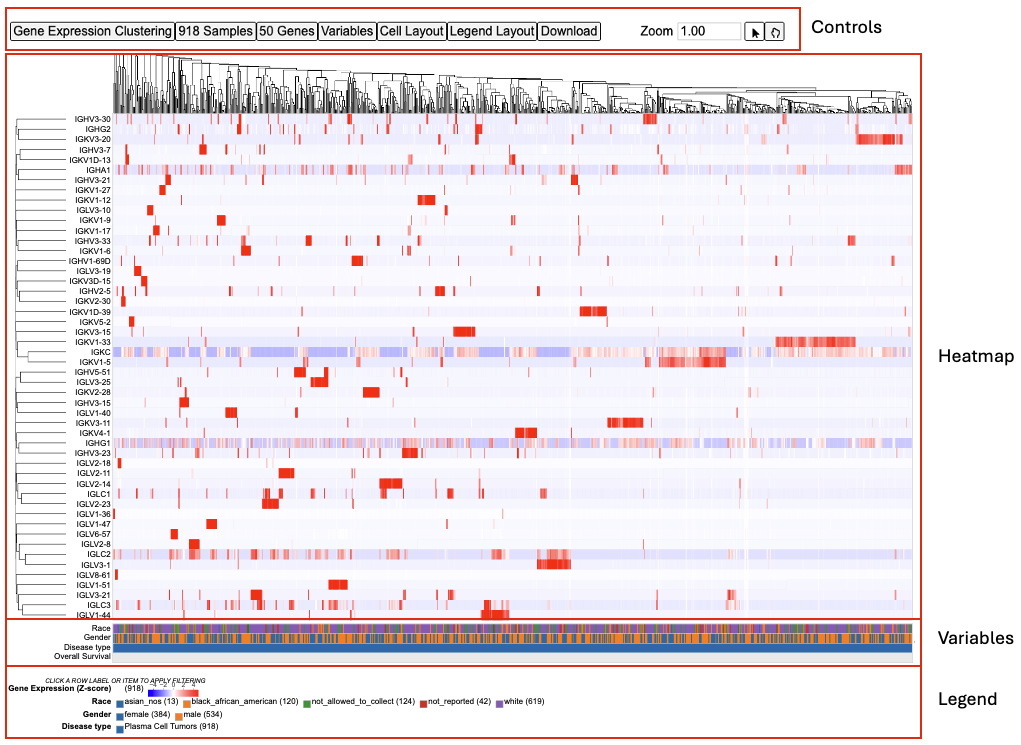
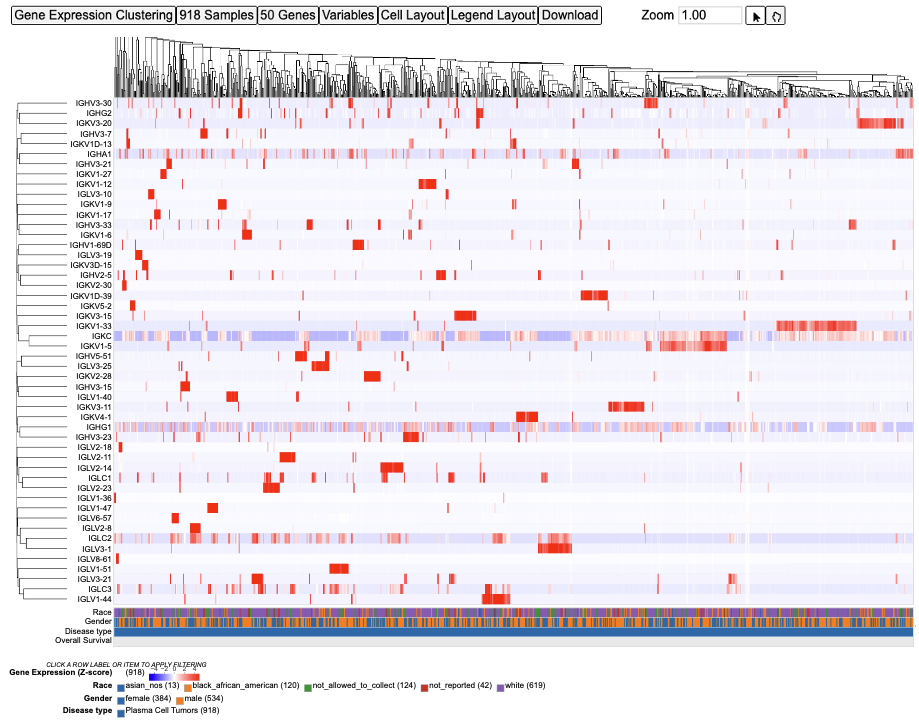
There are four main panels in the Gene Expression Clustering tool: controls, heatmap, variables, and legend.
Controls
The control panel can modify the displayed data or the appearance of the matrix. Their functionalities are outlined below.

- Gene Expression Clustering: Modify the default clustering of the heatmap (Average or Complete), alter the column and row dendrogram dimensions, and change the z-score cap
- Samples: Adjust the visible characters of the sample labels
- Genes: Modify how samples are represented for each gene (Absolute, Percent, or None), row group and label lengths, rendering style, and the existing gene set
- Edit Group: Displays a panel of currently selected genes, which can be modified by clicking on a gene to remove it from the gene set, searching for a particular gene to add, loading top variably expressed genes, or loading a pre-defined gene set provided by the MSigDB database
- Create Group: Create a new gene set by searching for a particular gene, loading top mutated genes, or loading a pre-defined gene set provided by the MSigDB database
- Variables: Search and select variables to add to the matrix below the heatmap
- Cell Layout: Modify the format of the cells by changing colors, cell dimensions, and label formatting
- Legend Layout: Alter the legend by changing the font size, dimensions, and other formatting preferences
- Download: Download the plot in svg format
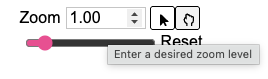
- Zoom: Adjust the zoom level by using the up and down arrows on the input box, entering a number, or using the sliding scale to view the case labels
Heatmap
The Gene Expression Clustering heatmap displays the active cohort's samples along the top horizontally, genes along the left column, and the z-score transformed gene expression value.
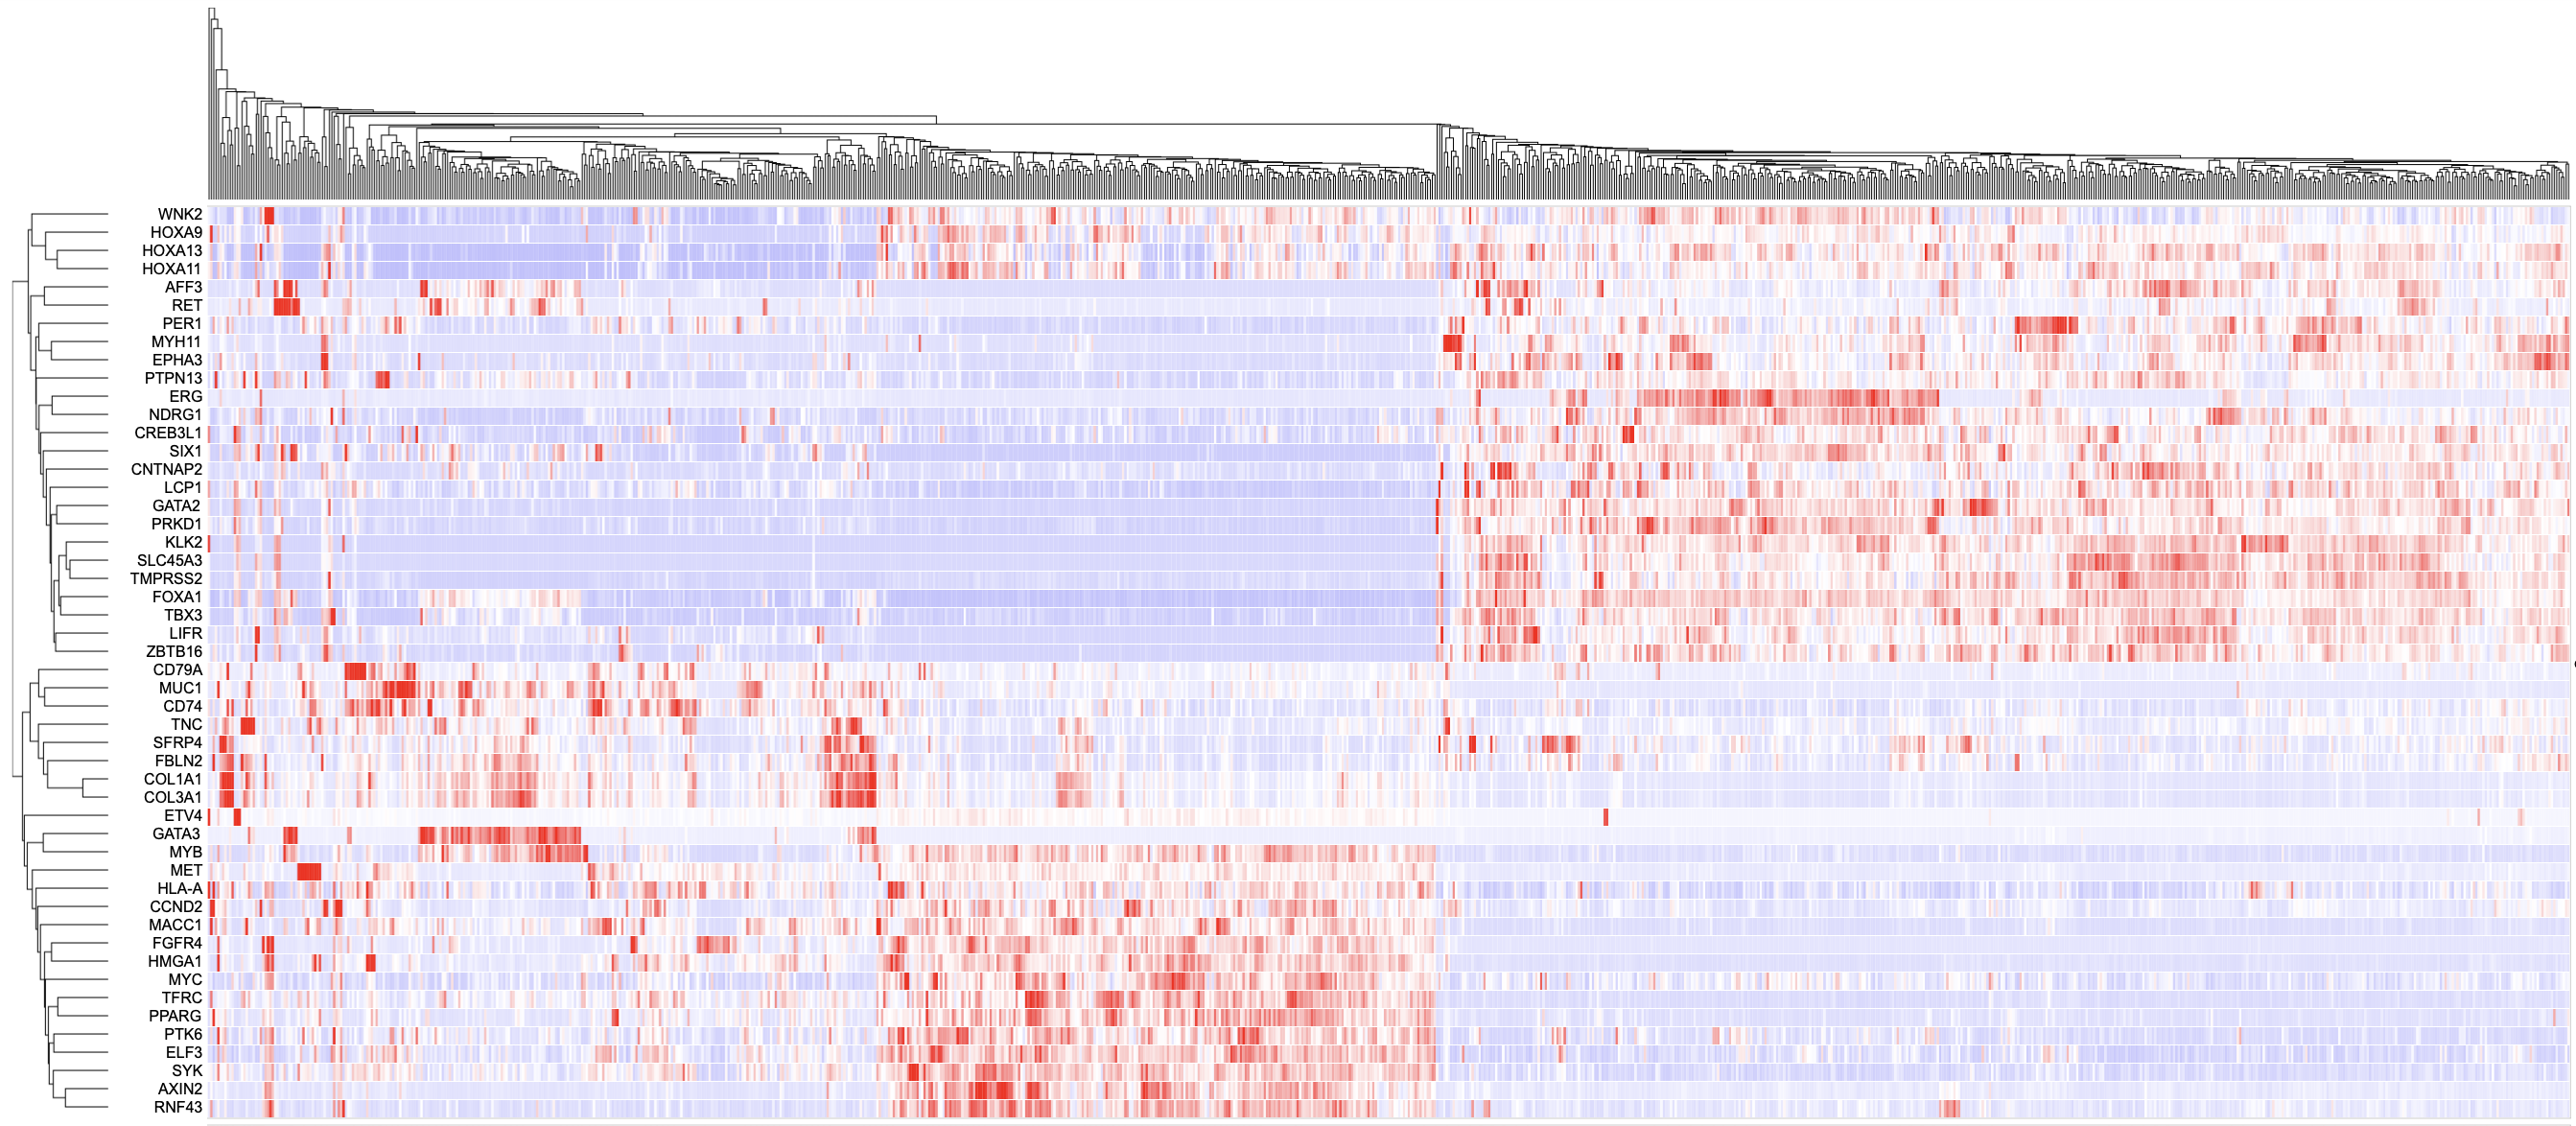
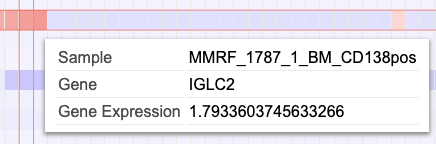
Hovering over a cell in the heatmap displays the case submitter_id, gene name, and gene expression value.
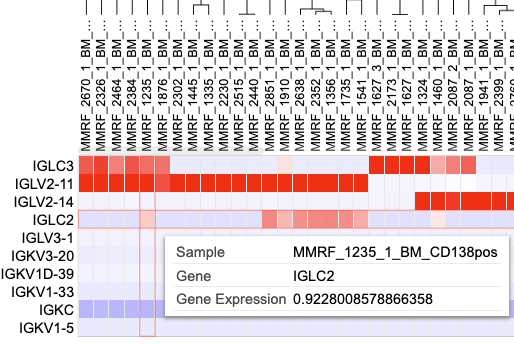
Clicking on a cell also gives users the option to launch the Disco plot, a circos plot displaying copy number data and consequences for that case.
Selecting samples on the cluster
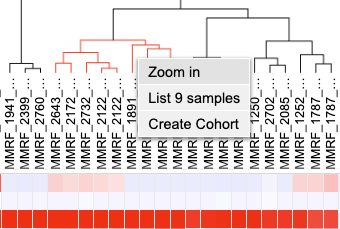
Samples on the cluster can be selected by clicking on the dendrogram. Once part of the dendrogram is selected, users can choose to zoom in to the samples, list all highlighted samples, or create a cohort of the selected samples.
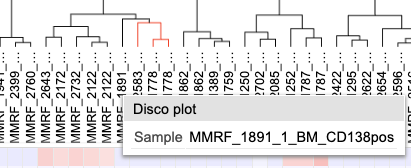
Click on a case in the dendrogram to showcase the Disco plot.
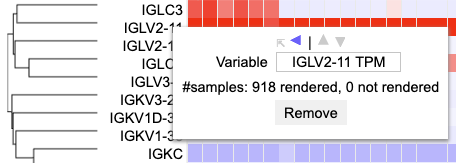
In the column of genes on the left, click on a gene to rename it, reposition it within the dendrogram, or remove the gene. The lollipop plot displays all samples affected by SSMs in the selected gene.
Variables
Any variables added to the matrix appear below the heatmap. Users can hover over a cell to display the case submitter_id and their value for the given variable.

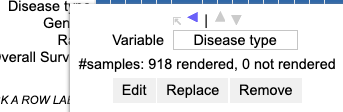
Click on a variable to rename it, edit it by excluding categories, replace it with a different variable, or remove it entirely.
Legend
In addition to the color coding system for the gene expression values, the legend displays the number of samples from the active cohort in each category for all variables that are selected to appear in the matrix.

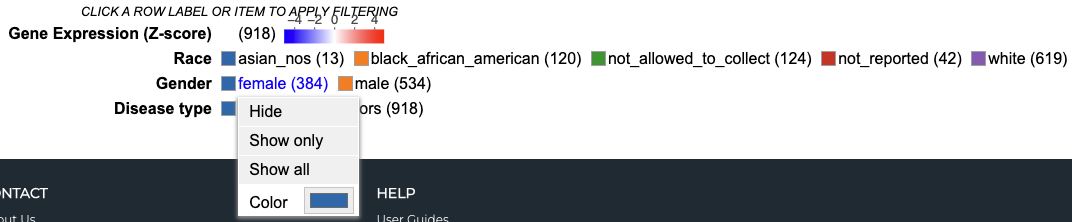
Users can click on a variable in the legend to hide a specific category, only show a specific category, show all categories, or change the color for the selected variable.

Accessing the Tool
At the analysis center, click the 'Gene Expression Clustering' card to launch the heatmap.
View publicly available genes as well as login with credentials to access controlled data.
Features
The following features are viewable once the heatmap is loaded. There are four main panels as outlined in the figure i.e., the 'Controls', 'Heatmap', 'Variables' and the 'Legend'. Each of the features and functionalities are described in detail in the following sections.
Controls
The control panel as shown has various functionalities with which users can change or modify the appearance of the matrix. The control panel provides flexibility and a wide range of options to maximize user control.
Adjusting the Zoom
Adjust the zoom level by using arrows on the input box or entering a number to be able to view the sample labels as shown.
Gene Expression Clustering
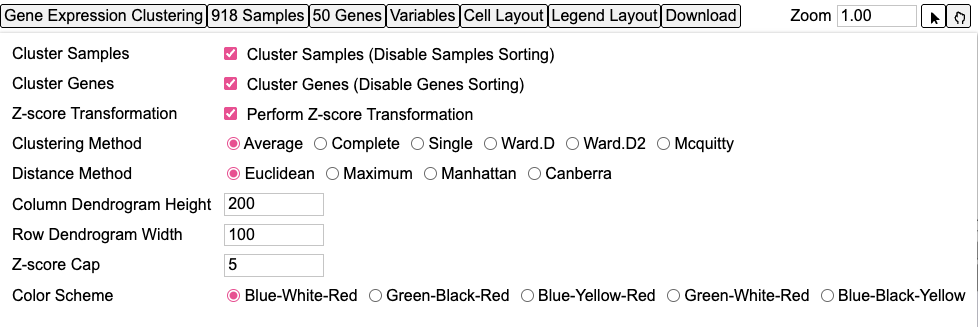
The clustering control button provides several options to modify the default clustering of the heatmap. Click on the button labeled 'Gene Expression Clustering' to display a menu with options as shown.
Cluster Samples
Check/uncheck to show/hide the sample row dendrogram.
Cluster Genes
Check/uncheck to show/hide the gene row dendrogram.
Z-score Transformation
Check/uncheck to perform a Z-score Transformation or a TPM Transformation, respectively.
Clustering and Distance Method
Click on the 'Complete' option as highlighted to change the method of clustering. The heatmap will render again to show the complete clustering method.

Change the distance calculation method using the highlighted option. The heatmap will automatically re-render to reflect the newly selected distance metric.

Column and Row Dendrogram Width
The maximum height of the column and row dendrograms are shown in the next highlighted options. Click or edit the number in each input box to adjust the height of the column or row dendrograms.

Z-score Cap
Z scores are used to compare gene expression across samples. A Z-score of zero indicates that the gene's expression level is the same as the mean expression level across all samples, while a positive Z-score indicates that the gene is expressed at a higher level than the mean, and a negative Z-score indicates that the gene is expressed at a lower level than the mean.
User can increase or decrease the Z-score Capping. Increase the Z-score cap from 5 to 10 as shown. Samples with lower gene expression gets lighter to allow highlighting of clusters with higher expression values as shown in red in the heatmap.

Color Scheme
Change the heatmap color scheme using the available color palette options. The heatmap will automatically update to reflect the selected color scheme.

Samples
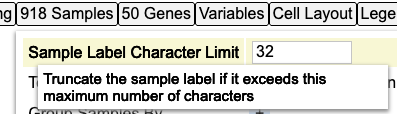
Sample Label Character Limit
Adjust the maximum number of visible characters displayed for sample labels. The default value is 32. Changing this value will update the labels shown in the heatmap and dendrogram. Reducing the character limit will truncate longer sample names.
Toggle sample labels
Show or hide sample names within the dendrogram. Disabling sample labels can improve readability when visualizing large datasets.

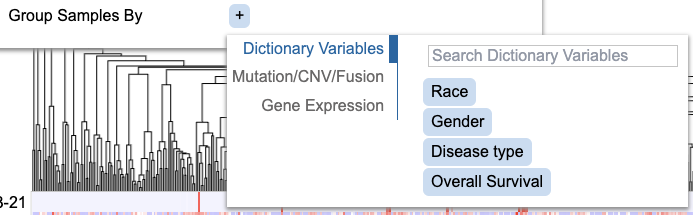
Group Samples By
Control how samples are organized within the visualization. Samples can be grouped by their default ordering or by one of the available data categories, including Dictionary Variables, Mutation/CNV/Fusion, and Gene Expression.
Genes
Users can modify the currently selected gene set by clicking the "Genes" button in the control panel. This opens a menu that allows users to edit the active gene group and customize the genes included in the analysis.
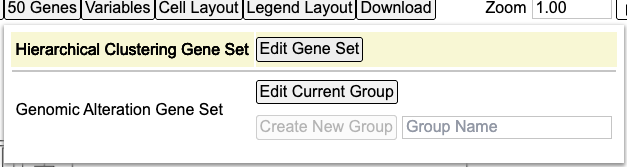
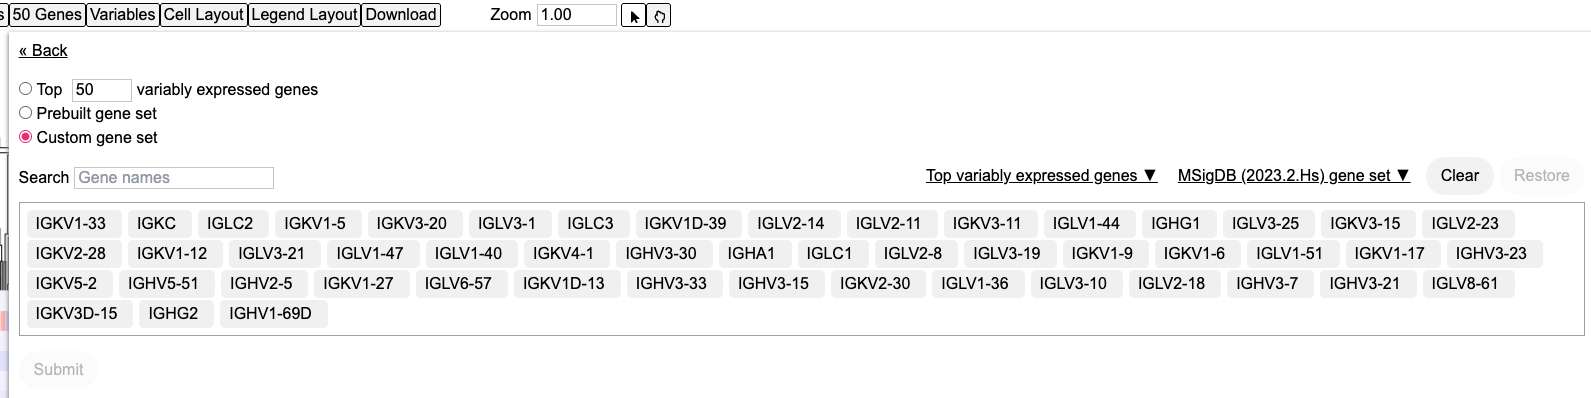
From the "Genes" button on the control panel, click "Edit Gene Set" under Hierarchical Clustering Gene Set to display the currently selected genes. From this interface, users can modify the gene set using the same options available when initially generating the heatmap.
Top Variably Expressed Genes
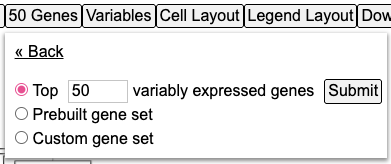
The user has the option to load the top genes that are variably expressed. The genes will change to the top most variable genes as shown in this selected cohort. Click submit to reload the heatmap.
Prebuilt Gene Sets
Alternatively, users can select from a variety of prebuilt gene sets provided by the MSigDB database. The current version enabled is the latest. Click on the dropdown button 'Load MSigDB (2023.2.Hs) gene set' and choose one of the following gene sets as shown.
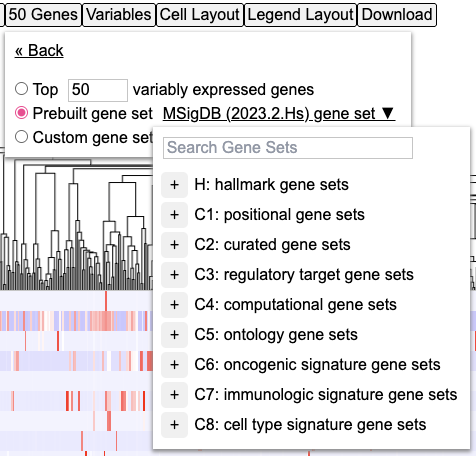
Available gene set categories can be expanded to browse and select the specific gene set of interest.
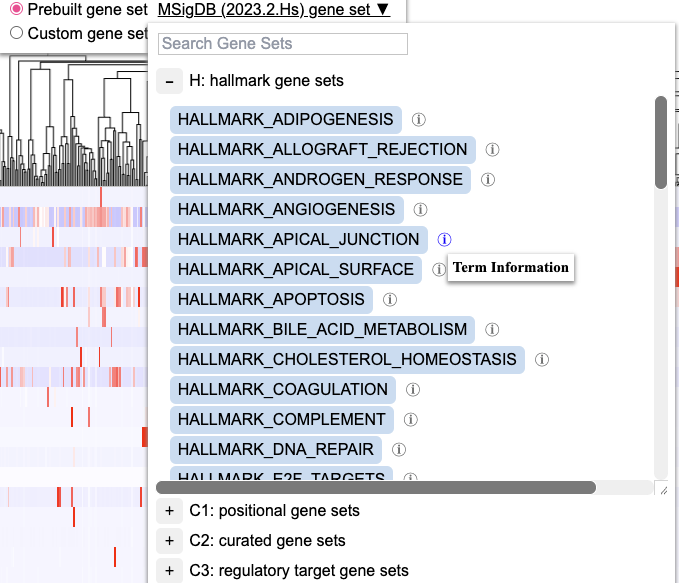
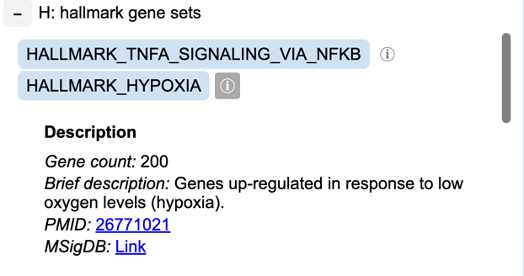
Note the info icon next to the gene set that provides additional information about this gene set as well as a link to the database and the original publication PMID as shown.
Upon selecting a MSigDB gene set, the genes get updated as shown.
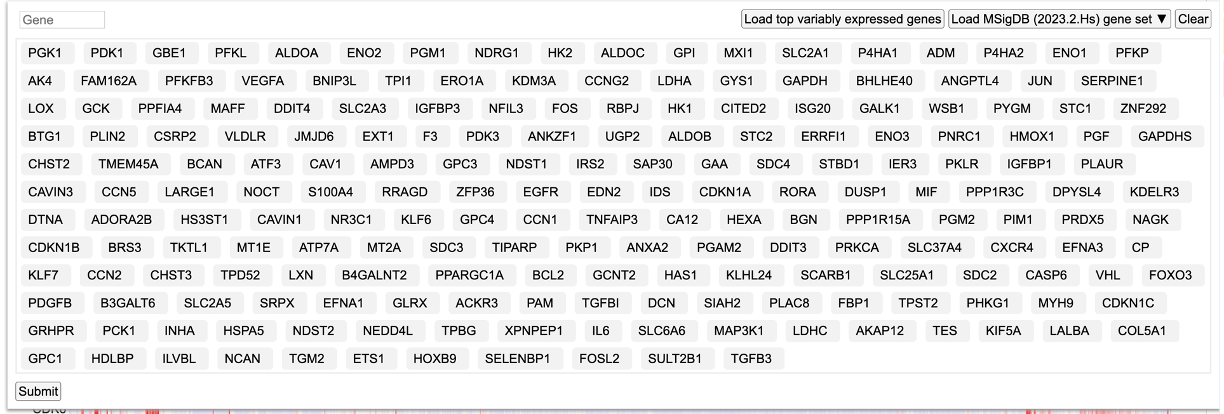
Click 'Submit' to reload the heatmap with the new gene set from MSigDB.
Custom Gene Set
Users may also create a custom gene set directly within the interface by selecting individual genes to include in the analysis.
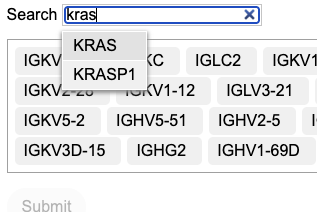
To add a gene, type in the gene of interest into the search box (i.e., 'KRAS') as shown and click submit.
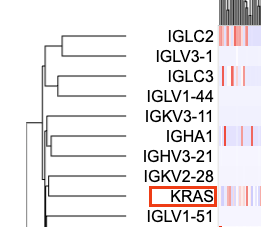
The heatmap loads again after performing a clustering that includes 'KRAS' as shown.
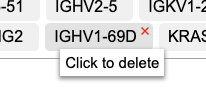
To delete a gene, hover over the gene as shown. A red cross mark will appear as shown. Click on the gene to delete it from the gene set. Click submit to redo the clustering.
Adding gene as a variable
User also has the option to add gene variant terms as variable to line up mutation consequences with clustered gene expression data.
To do so, click the button 'Genes' and under Genomic Alteration Gene Set click 'Edit Current Group'.

From there, you'll see the same options as what was present in the Hierarchical Clustering Gene Set and all options work the same way as before. To show an example of what it would look like to add just one gene as a variable follow along down below.
First, under custom gene set search and select 'KRAS'.
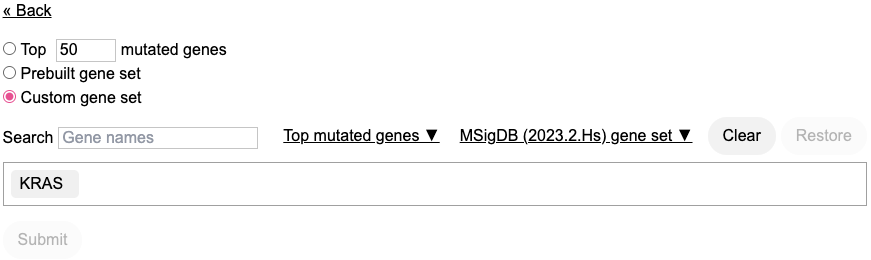
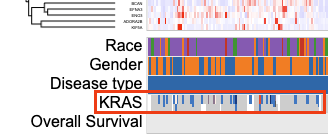
Click 'Submit' to reload the heatmap with the newly added KRAS gene as a variable. This displays the consequence type for the clustered samples for which KRAS has both the mutation calls and the gene expression data as shown.
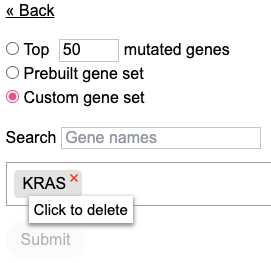
To remove KRAS, return to the "Edit Current Group" and under "Custom gene set" click on the KRAS gene to remove it from the variable panel.
Variables
The button 'Variables' in the controls allows the user to search and select variables that get added below the heatmap.
Click the button 'Variables' to show the following dictionary tree.
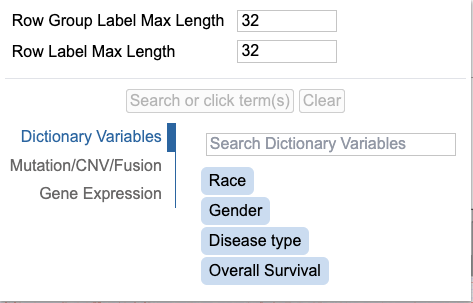
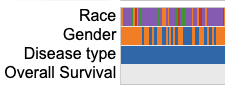
Once the variable terms are submitted, the heatmap will display the added variables as shown.
Cell Layout
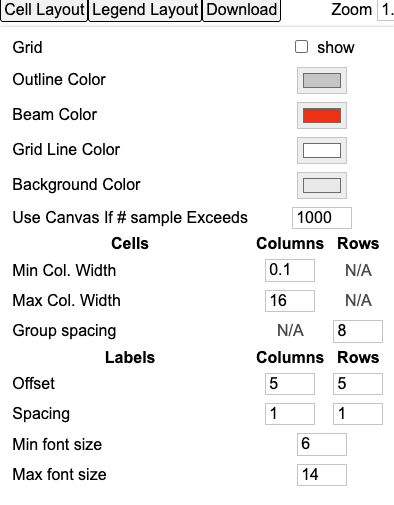
The button 'Cell Layout' in the controls allows the user to edit the look of the heatmap.
Click the button 'Cell Layout' to show the following option tree.
Legend Layout
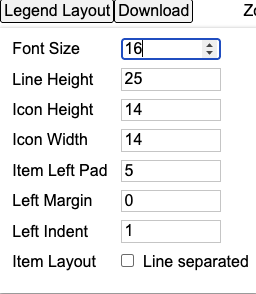
The button 'Legend Layout' in the controls allows the user to edit the look of the legend.
Click the button 'Legend Layout' to show the following option tree.
Download
The control panel shows an option to download the plot as an svg after user has specified their customizations. Select the 'Download' button as shown below to save the svg.
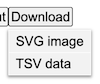
The user will be prompted to choose a place to save the downloaded SVG or TSV file.
Heatmap
Selecting samples on the cluster
Samples on the cluster can be selected interactively by clicking on the column dendrograms. Click on the dendrograms above the heatmap as shown. The dendrograms get highlighted in red.

Once the dendrograms are selected, two options are displayed. A user can choose to zoom in the samples or list all the samples highlighted in the dendrograms.
Clicking a case column
Click on a case label to display the options as shown.
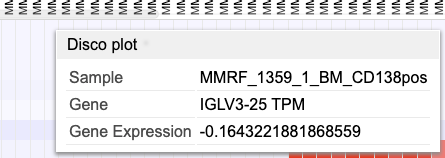
User may choose to launch: - a circos plot by clicking 'Disco plot' button, - a webpage containing information about the case by clicking the case id - Gene summary page by clicking on the gene name 'PDGFRA'
Clicking a gene label
Click on a gene row label to display the following options
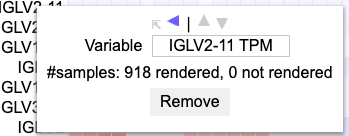
User can choose to change variable name by deleting and typing in a new name in the box where 'PDGFRA' is currently applied. User may also choose to launch the lollipop plot or gene summary page or remove this row entirely.
Hovering over/Clicking a cell
Hover over a cell of the heatmap to show information about the case. The information displayed shows the case id, the gene name (CCND1) and the z-score transformed value (4.04..)
Variables
Clicking a Variable
Click on a variable (for example 'Project id' here) row label to display the options as shown.
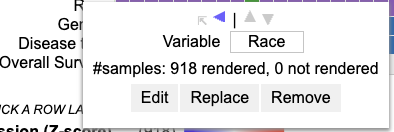
User can change the variable name (input box), edit the variable to exclude categories ('Edit' button), replace the variable by another one ('Replace' button) or remove the row containing the variable entirely by clicking the 'Remove' button.
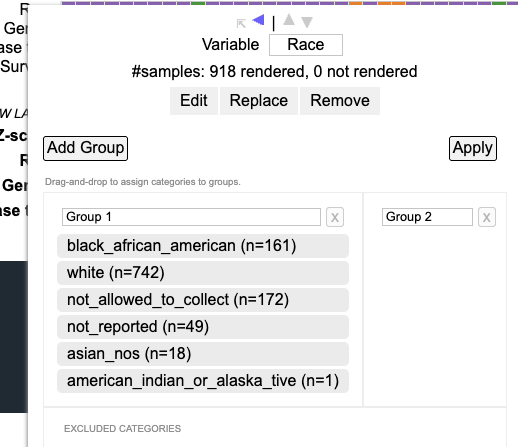
Editing a variable
To edit groups within the variable, click the 'Edit' button. Now, user can drag the categories from group 1 into group 2 to create two separate groups and also have the option to exclude a category. After making the choice, click 'Apply' to reload the chart.
Replacing a variable
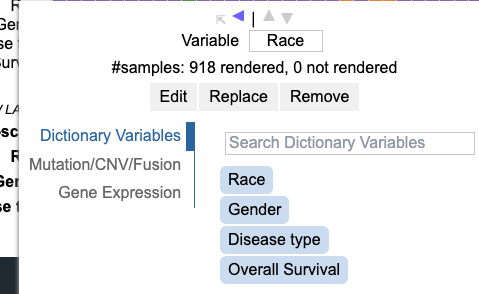
To replace a variable, click on the row label for that variable and click 'Replace'. This shows the dictionary from which a user can select a variable of choice as shown.
Removing a variable
To remove a row containing a variable entirely, click on the row label for that variable and click 'Remove'. This removes the entire row from the heatmap.
Legend
Interacting with legend filters
Variables can be filtered upon via the legend. Click a legend item to display the following options. Users may choose to 'Hide', 'Show only', 'Show all', or change the color of the categories from a selected variable. This would allow the user to filter down on the category of choice.